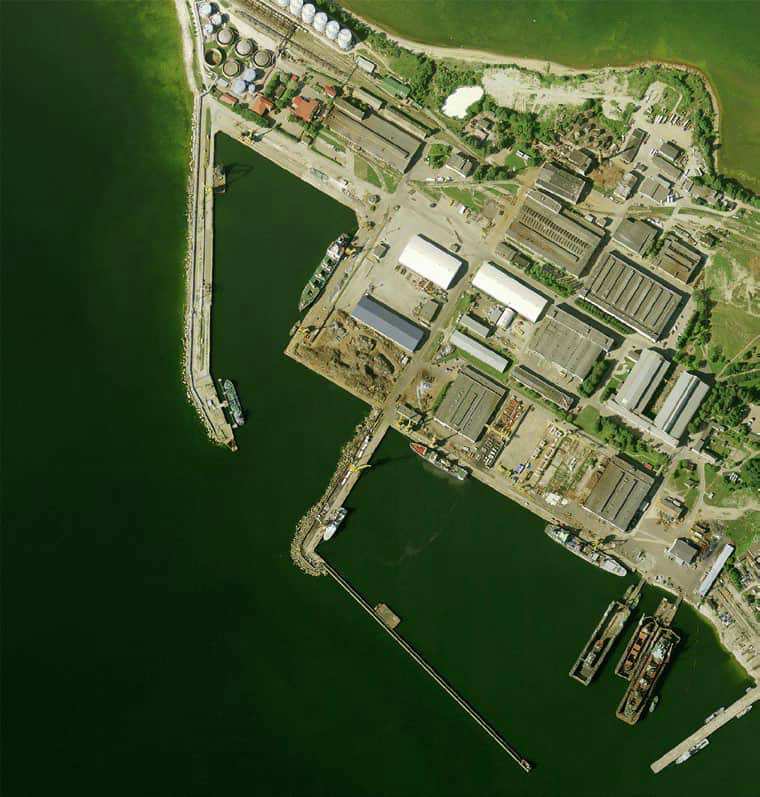
Vene-Balti sadam
Harju county and Tallinn · Soome laht
At a glance
- 10.2 mMaximum draughtregister
- 158 mMaximum lengthregister
- 35 mMaximum beamregister
- 10.6 mQuay depthregister
- All yearNavigation periodregister
Maximum draught is the limit the register publishes for entering; quay depth is the register's figure for the deepest quay — other quays may be shallower. Neither guarantees a berth that suits your boat.
Services
- Shore powerUnknown
- WaterUnknown
- WCUnknown
- FuelUnknown
- Wi-FiUnknown
- WasteUnknown
- ParkingUnknown
Prices and availability
Price not published — ask the harbour. Confirm prices and availability for your dates with the harbour, including which services the price covers.
Arrange your place, price and arrival directly with the harbour.
Arrival
Harju maakond, Tallinn, Põhja-Tallinna linnaosa, Kopli tn 103, 11712
Harbour plan
Not for navigation. See every harbour on the map.
View in Nutimeri (Transpordiamet, opens in a new tab) — Transpordiamet
Official navigation charts and markers, for information only — not a primary navigation aid.
Sailing directions
Based on a published sailing directions guideUse together with an up-to-date nautical chart and navigational warnings.
Sources
- Sailing directions Lootsiraamat 4.2 — Suurupi poolsaarest Kaberneeme poolsaareni
Published 12 Sept 2026 · revision 3
Historical wind statistics
Prevailing winds
How often the wind blew FROM each direction, May–September 2021–2025.
Modelled data, not measured at the harbour
Rings: May (inside) → Sep (outside). Figure at the edge: share of the whole season.
The wind most often came from W (12 % of the season's hours).
- under 3 %
- 3–6 %
- 6–9 %
- 9–13 %
- 13–20 %
- 20 % or more
Regional model data cannot show how sheltered the harbour is, or how the wind moves around its piers and breakwaters.
Data as a table
| Wind from | May | Jun | Jul | Aug | Sep | Season |
|---|---|---|---|---|---|---|
| N | 4.2 % | 4.3 % | 2.7 % | 3.3 % | 4.6 % | 3.8 % |
| NNE | 3.4 % | 2.0 % | 2.1 % | 1.9 % | 2.9 % | 2.5 % |
| NE | 4.2 % | 2.7 % | 4.1 % | 3.5 % | 2.5 % | 3.4 % |
| ENE | 6.2 % | 5.2 % | 7.8 % | 5.3 % | 4.7 % | 5.8 % |
| E | 4.2 % | 4.9 % | 4.0 % | 4.8 % | 5.7 % | 4.7 % |
| ESE | 3.5 % | 3.7 % | 3.0 % | 4.6 % | 5.3 % | 4.0 % |
| SE | 3.1 % | 3.4 % | 4.5 % | 5.8 % | 9.3 % | 5.2 % |
| SSE | 3.3 % | 3.8 % | 4.7 % | 8.1 % | 11 % | 6.2 % |
| S | 4.8 % | 4.7 % | 3.5 % | 7.1 % | 8.0 % | 5.6 % |
| SSW | 5.8 % | 6.4 % | 7.1 % | 9.2 % | 8.1 % | 7.3 % |
| SW | 7.1 % | 9.9 % | 13 % | 10 % | 8.5 % | 9.7 % |
| WSW | 12 % | 13 % | 14 % | 12 % | 6.8 % | 11 % |
| W | 16 % | 14 % | 12 % | 9.8 % | 5.6 % | 12 % |
| WNW | 10 % | 10 % | 8.4 % | 6.8 % | 5.5 % | 8.2 % |
| NW | 5.7 % | 7.3 % | 5.3 % | 4.2 % | 5.7 % | 5.6 % |
| NNW | 5.0 % | 3.6 % | 2.6 % | 3.4 % | 5.2 % | 3.9 % |
| calm | 0.9 % | 0.9 % | 1.0 % | 0.3 % | 0.4 % | 0.7 % |
| % | 100 % | 100 % | 100 % | 100 % | 100 % | 100 % |
Calm: below 0.5 m/s; counted in the total, not in any direction. 18360 valid hours of 18360 expected.
Source: ERA5 reanalysis (ECMWF / Copernicus Climate Change Service), ~25 km grid · model grid point 7.2 km north-east of the harbour (59.500, 24.750) · May–September 2021–2025, UTC · 18360 valid hours of 18360 expected · Data retrieved 2026-10-07 · Contains modified Copernicus Climate Change Service information (ERA5), CC BY 4.0
Data: port register, record updated 4 Sept 2026.
Visitor observations
Sailors' experiences, not the harbour's official information.
Practical details and harbour documents
- Address
- Harju maakond, Tallinn, Põhja-Tallinna linnaosa, Kopli tn 103, 11712
- Navigation period
- 1. jaanuar - 31. detsember
- Harbour master
- Marek Rauk
- Position
- 59.45667° N, 24.65633° E
- Phone
- +372 6102216
- port@blrt.ee
- Website
- www.portvenebalti.ee
All services in the register
Veesõiduki sildumise võimaldamine · Veeliikluse korraldamine akvatooriumil ja sissesõiduteel · Laevajäätmete vastuvõtmine · Veesõidukite pukseerimine ja jäämurdmine akvatooriumil · Joogivesi · Internetiühenduse kasutamine · Kütus · Parkla · WC · Elekter · Prügivastuvõtt
Nearest harbours
Straight-line distance. Nearest does not mean suitable for your boat.
Tallinn bay, Paldiski, Naissaar and Aegna, plus the western half of Lahemaa out to Kolga and Hara. Short legs and most services open year-round. All harbours in Harju county and Tallinn →
Help complete this harbour
These facts are still missing. If you know one, tell us — every suggestion is reviewed before it is published.
No berth count yet — it tells a visitor whether they are likely to fit.
In Mervare Crew? Use your account email in the suggestion and the verified contribution counts for you. Mervare Crew →
Suggest a video for this harbour
Add a 3–30 second video file or a YouTube link. Videos are reviewed before publication; a suitable short clip may become the page hero.